API Dashboard
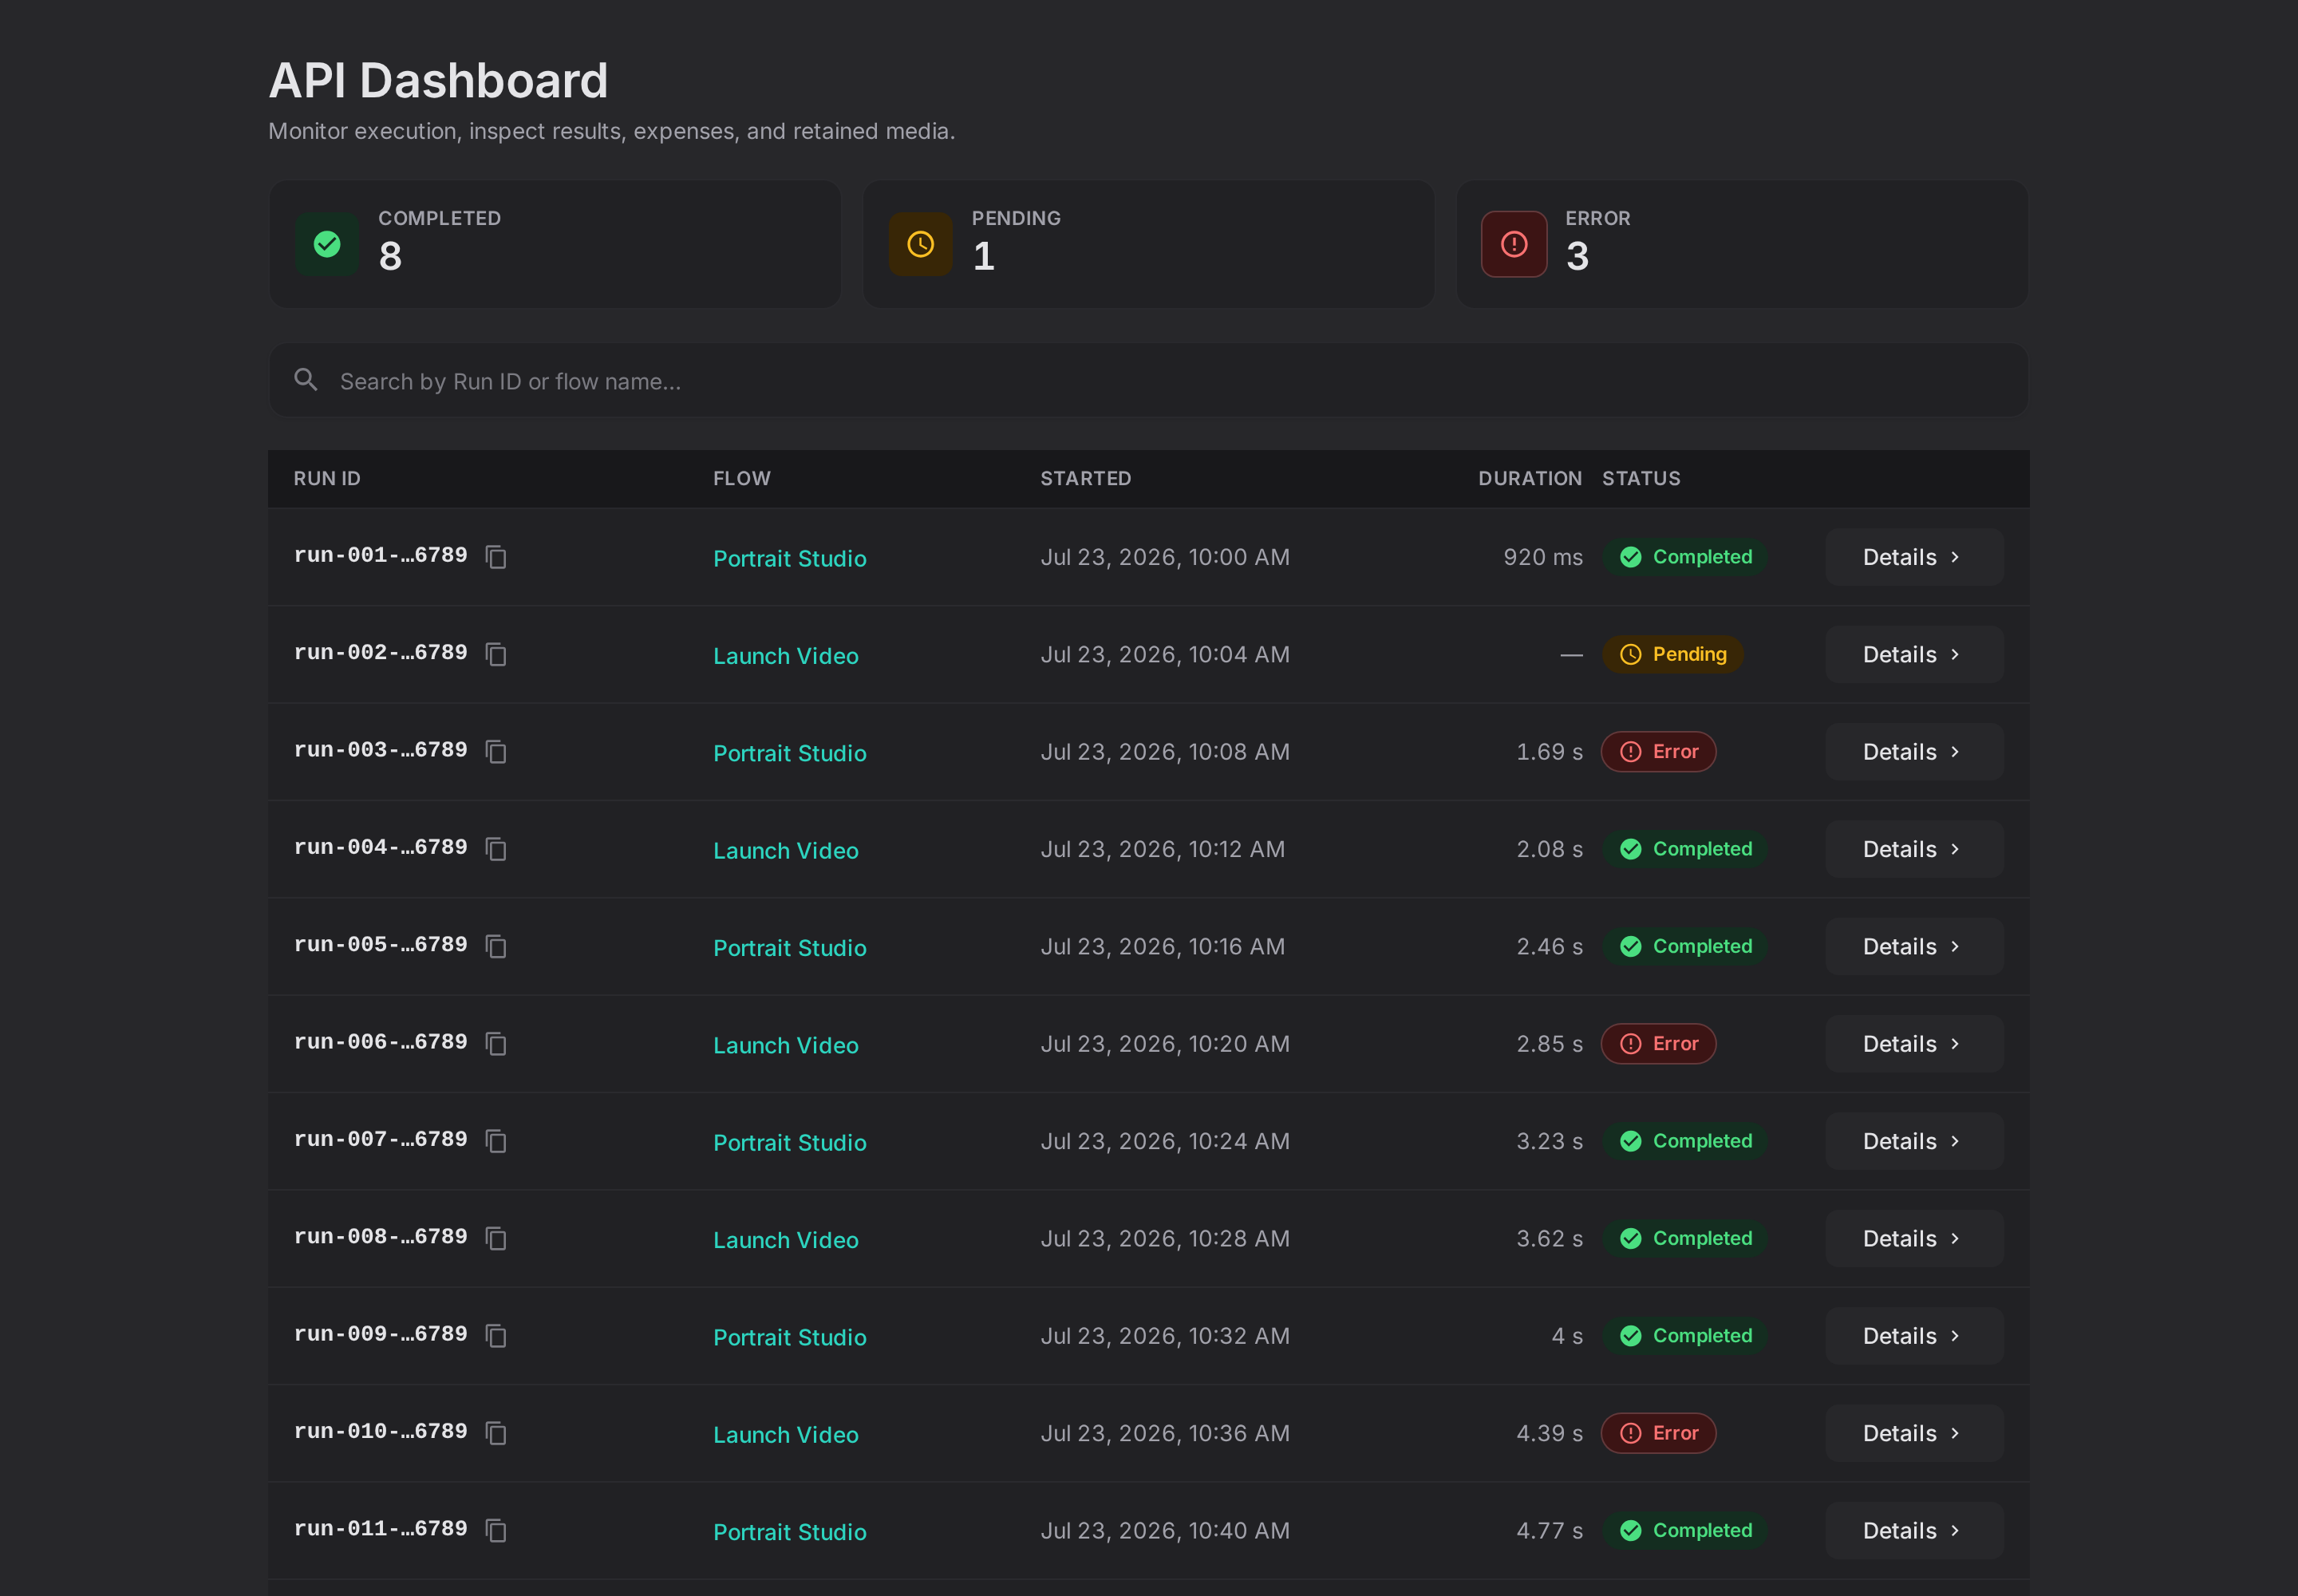
The API Dashboard is the operational view for workflows launched through the AI-Flow REST API. Use it to monitor recent runs, spot failures or slow executions, and inspect the data retained for a specific run without leaving AI-Flow.
What to use it for
The dashboard gives you one place to:
- see how many runs are completed, pending, or in error;
- search by run ID or workflow name;
- filter runs by status or workflow;
- compare execution duration for runs of the same workflow;
- copy a run ID for support or API troubleshooting;
- open a run to inspect its raw result, node history, expenses, and retained media;
The dashboard focuses on runs started through the API. Use the workflow editor for interactive editor runs.
Enable the API Dashboard
The navigation entry is opt-in for each browser:
- Sign in to AI-Flow with an account that has API access. Tier 3 or above is required.
- Open Settings.
- Select the API tab.
- Enable Show API dashboard in navigation.
- Close Settings and select API Dashboard in the main navigation.
The same API settings page also shows your access status and lets eligible accounts create API keys. Enabling the navigation entry does not grant API access or bypass plan restrictions.
Confirm that you are signed in, your account has Tier 3 or higher, and the dashboard toggle is enabled in the same browser. The preference is stored locally, so it may need to be enabled again in another browser or profile.
Read the board
The three summary cards are also filters. Select Completed, Pending, or Error to narrow the run list, then select the same card again to clear the filter.
Use the search field for a run ID or workflow name. Selecting a workflow name filters the dashboard to that workflow and reveals its recent duration trend when enough completed runs are available.
Each row shows the run ID, workflow, start time, wall-clock duration, and current status. Pending runs refresh automatically while they remain visible.
Inspect a run
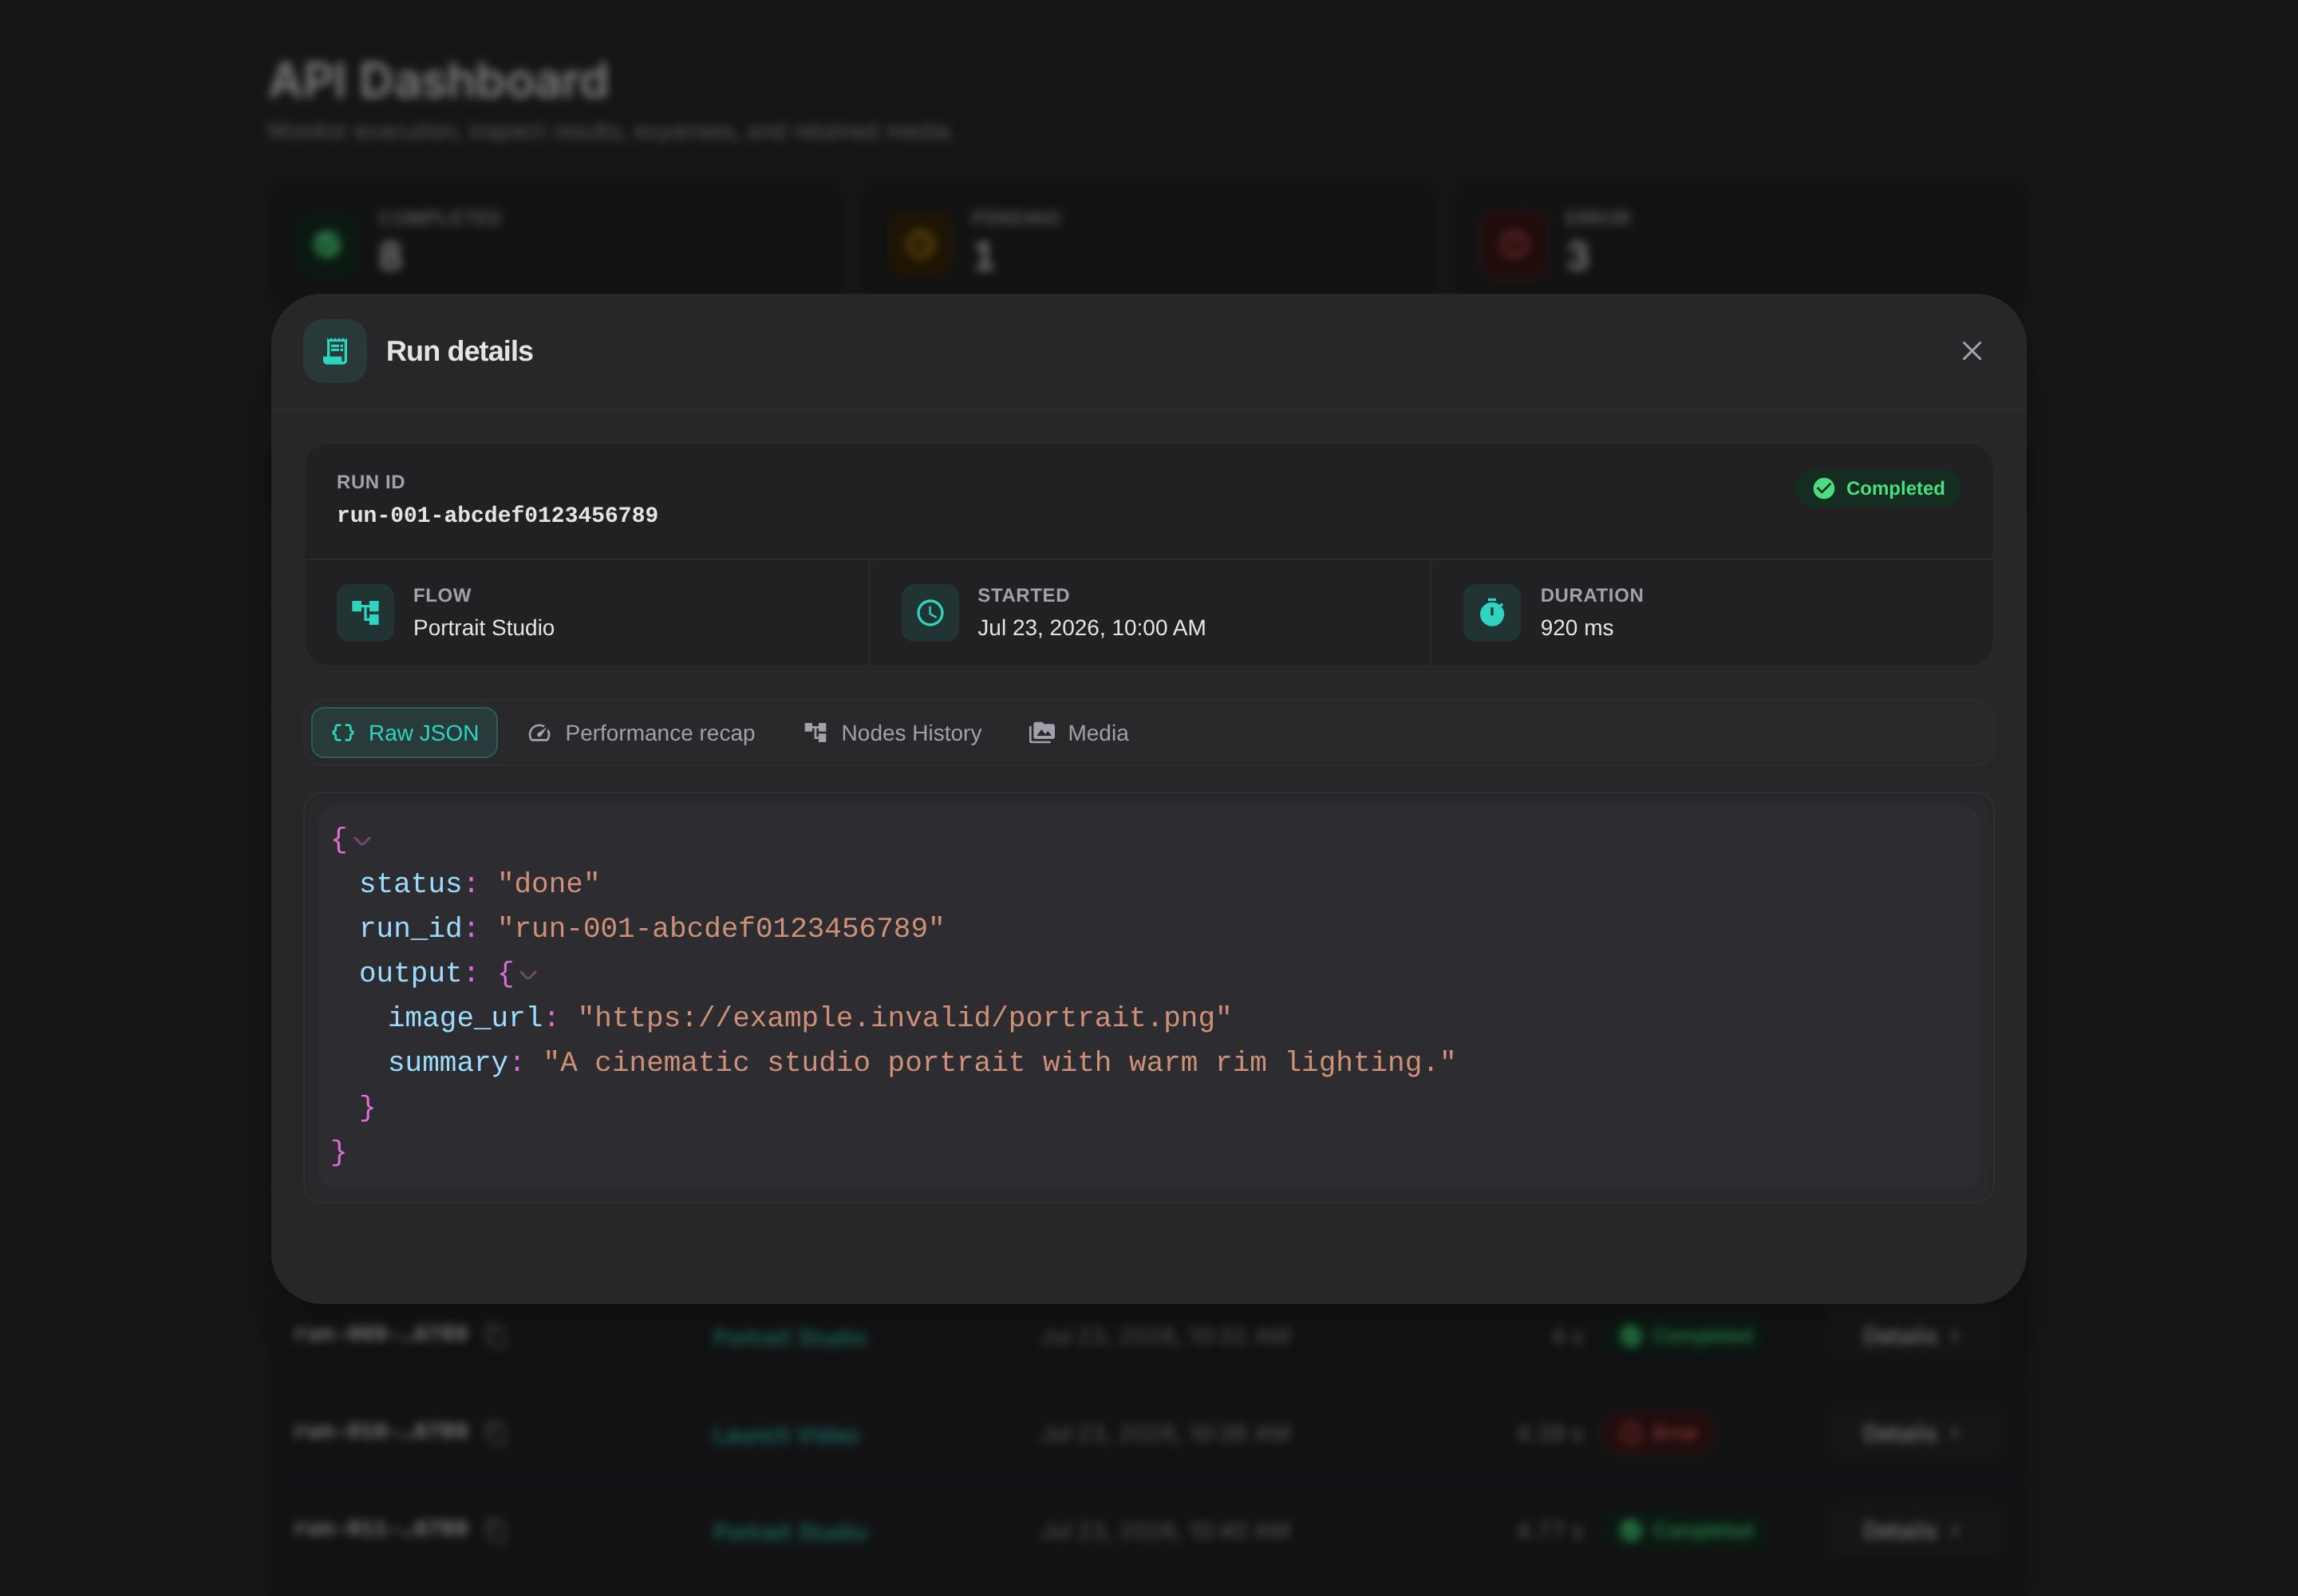
Select Details on any row to open the run-details panel:
- Raw JSON shows the stored API result.
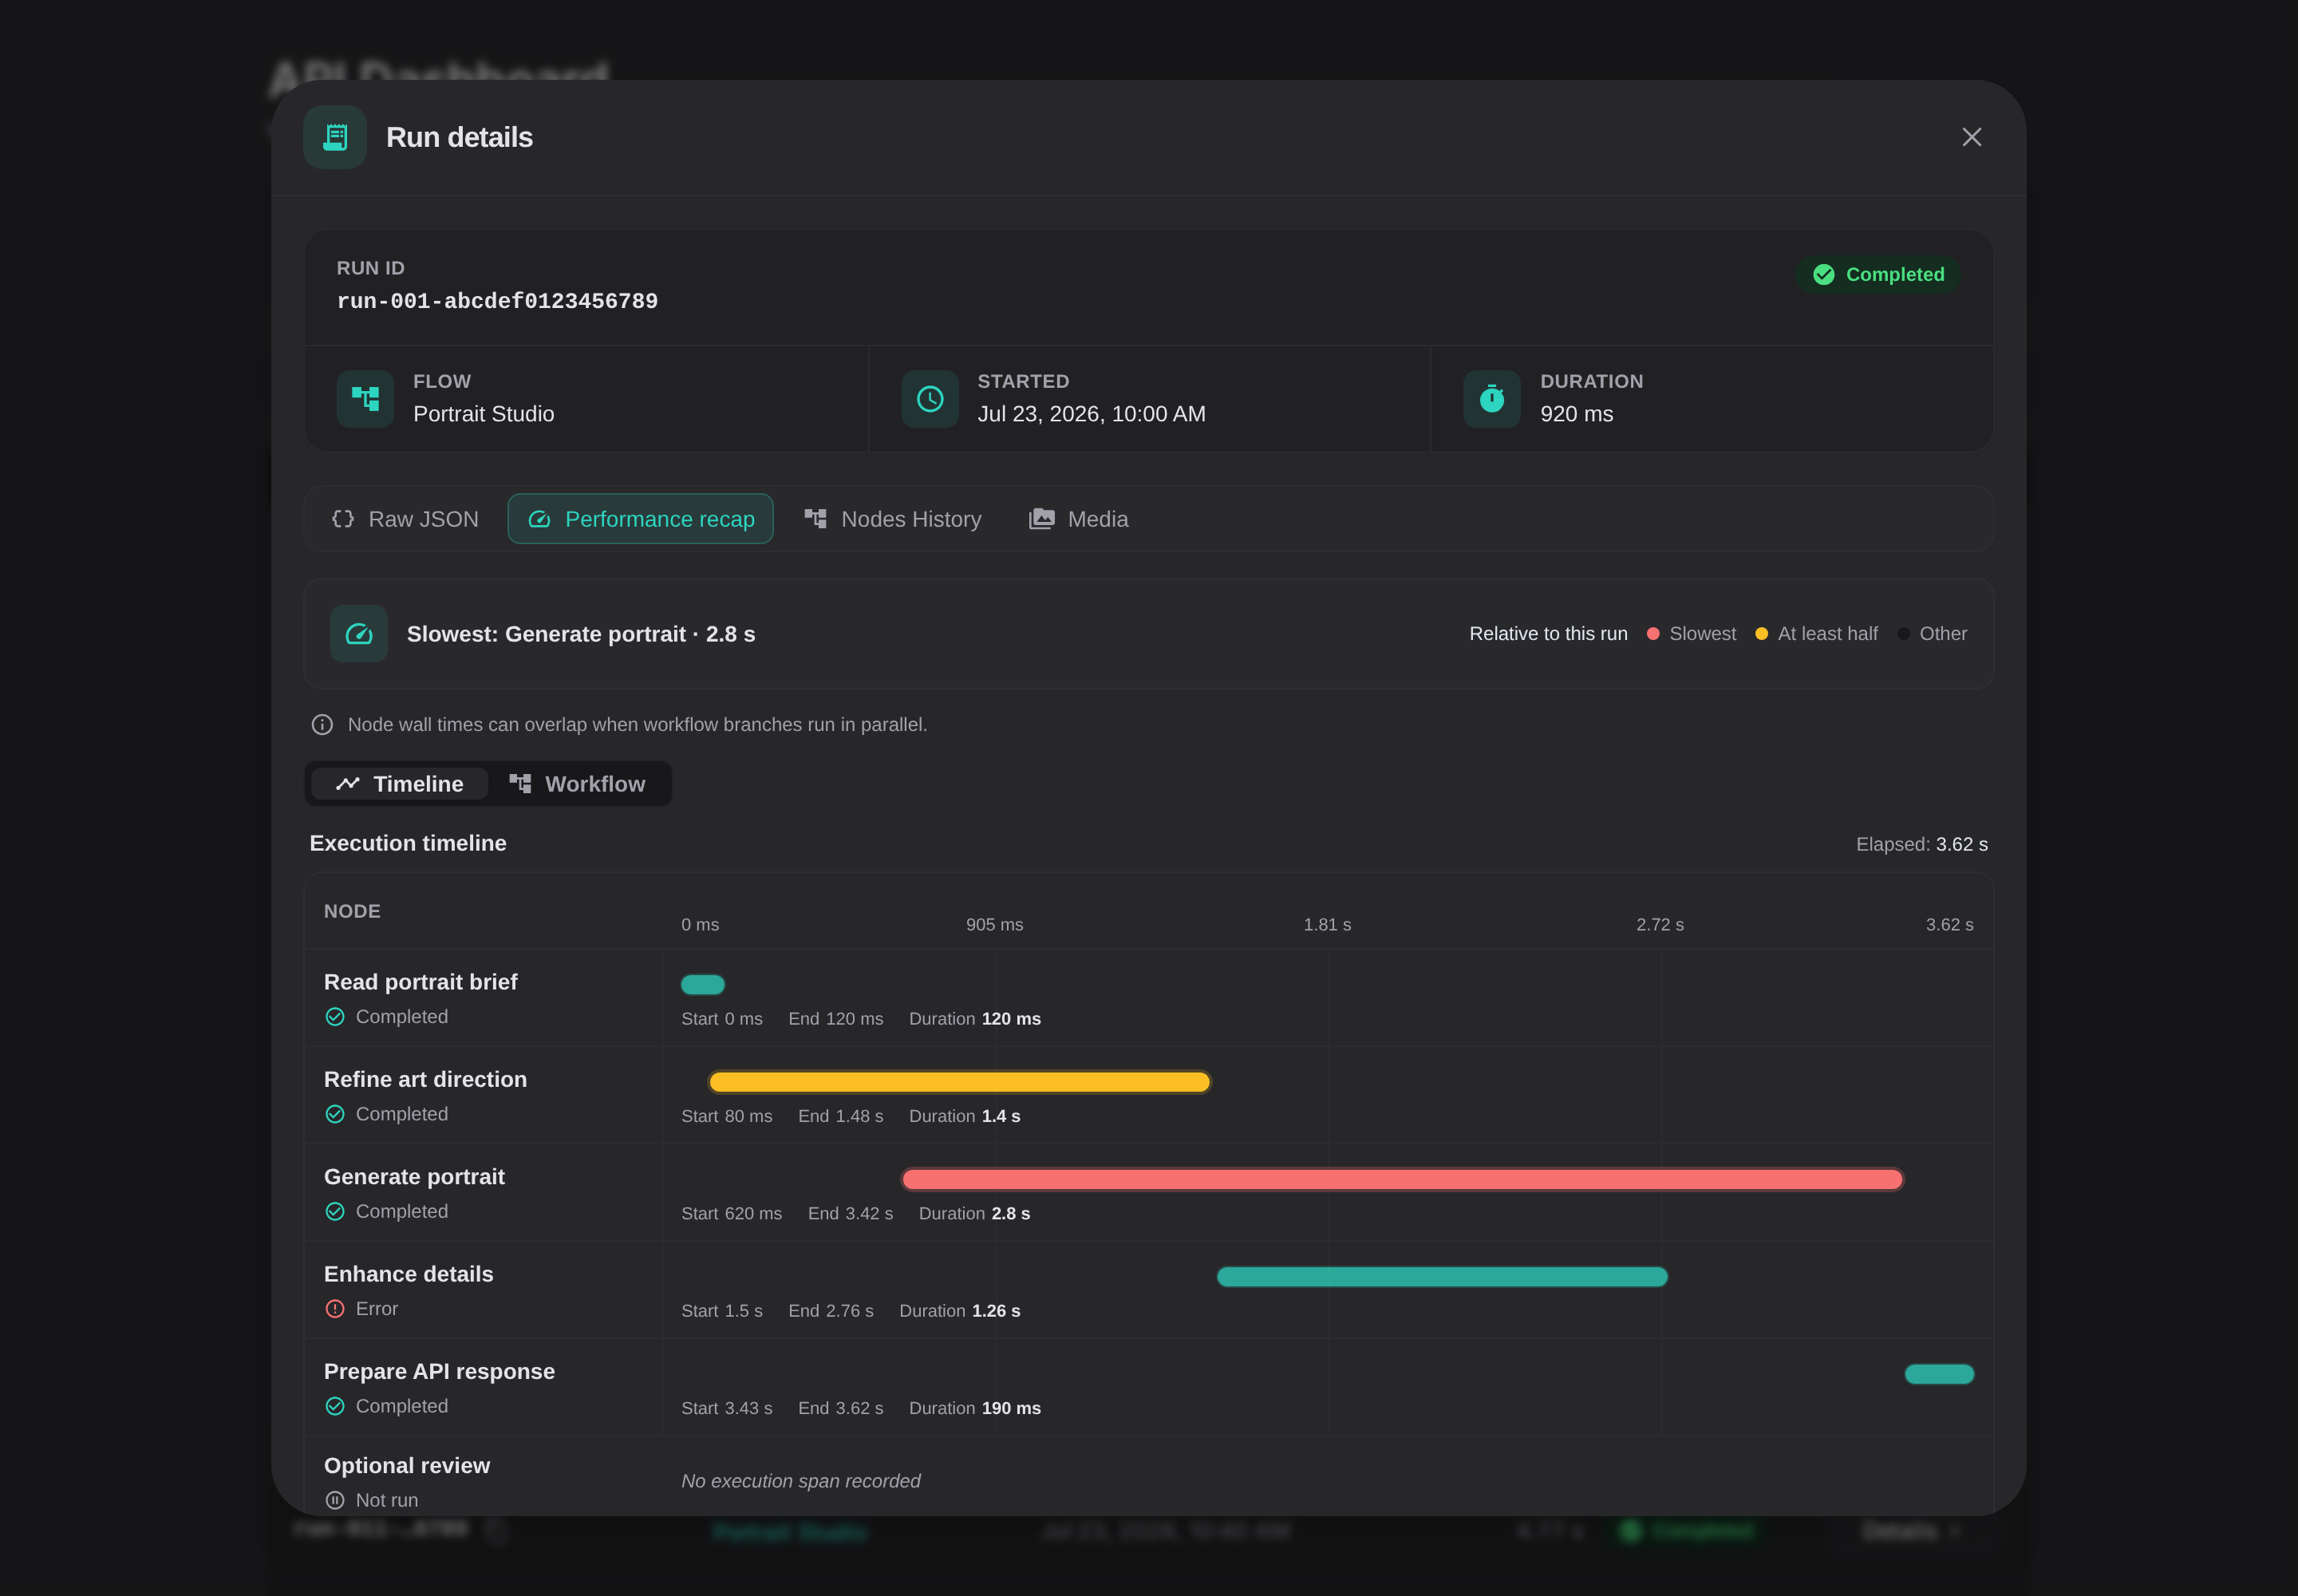
- Performance recap, when enabled and available for the run, opens an execution timeline and an optional read-only workflow view.
- Nodes History shows node-level execution and expense information.
- Media shows retained output media associated with the run.
Legacy runs or runs created without retained performance telemetry may not have a Performance recap. Their result and other available details remain usable.
Analyze execution time
Performance recap opens on the lightweight Timeline view. Every executed node is placed on the same elapsed-time scale, making slow nodes and parallel overlap visible at a glance. Start, end, duration, and status remain available as text; nodes that did not run have no fabricated timing span.
Switch to Workflow when you need the current saved topology and its connections. The workflow is read-only and timing badges are joined to matching node IDs.