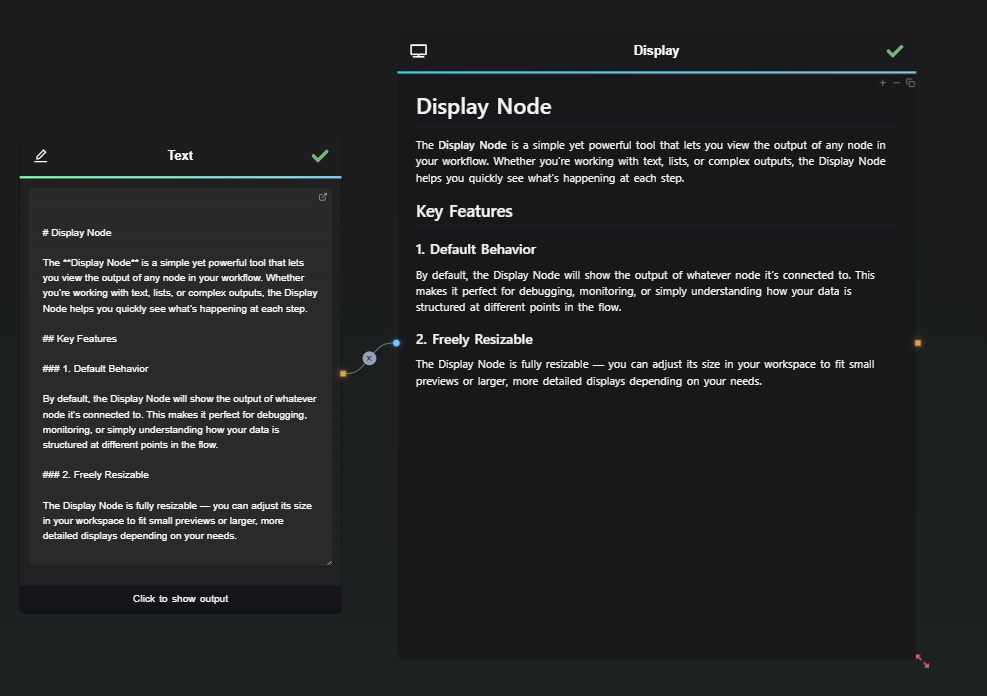
Display Node
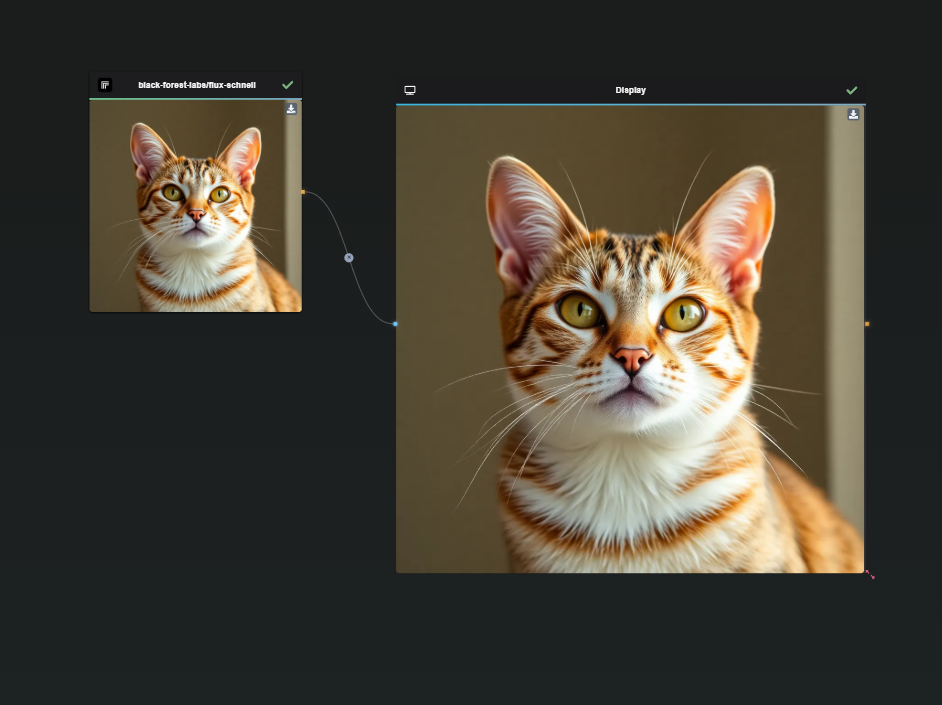
The Display Node is a simple yet powerful tool that lets you view the output of any node in your workflow. Whether you’re working with text, lists, or complex outputs, the Display Node helps you quickly see what’s happening at each step.
Key Features
1. Default Behavior
By default, the Display Node will show the output of whatever node it’s connected to. This makes it perfect for debugging, monitoring, or simply understanding how your data is structured at different points in the flow.
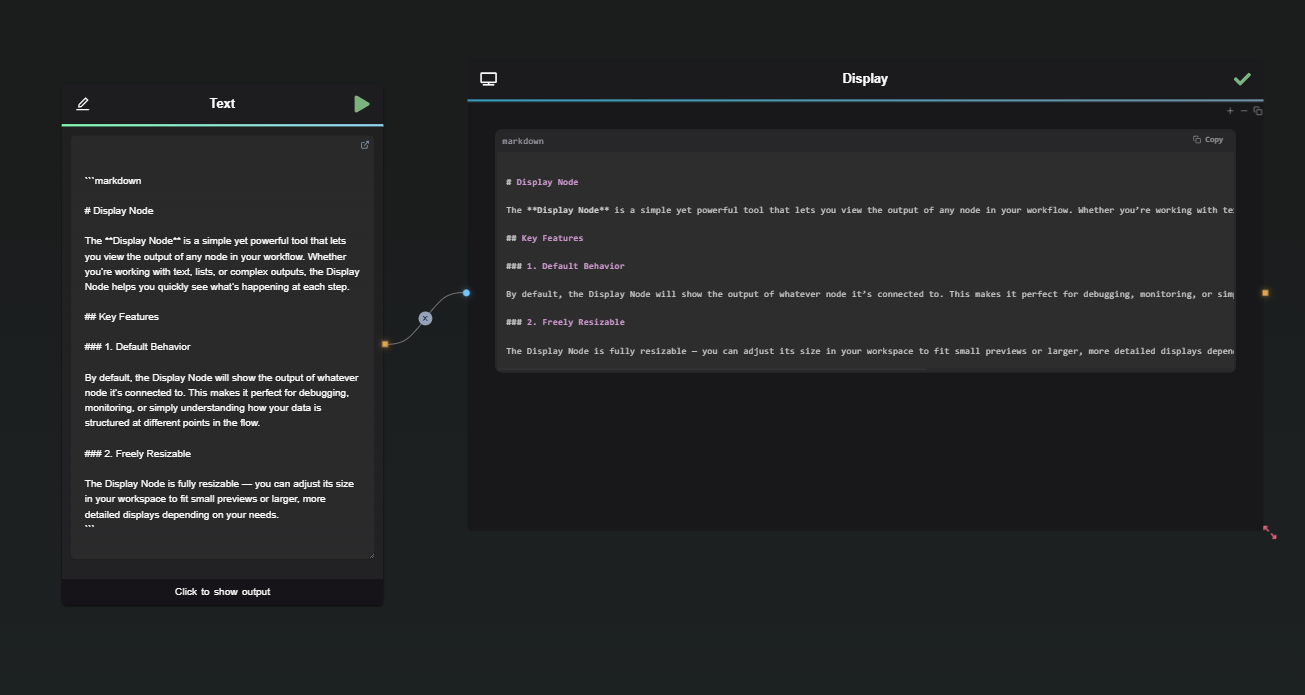
2. Freely Resizable
The Display Node is fully resizable — you can adjust its size in your workspace to fit small previews or larger, more detailed displays depending on your needs.
Display List
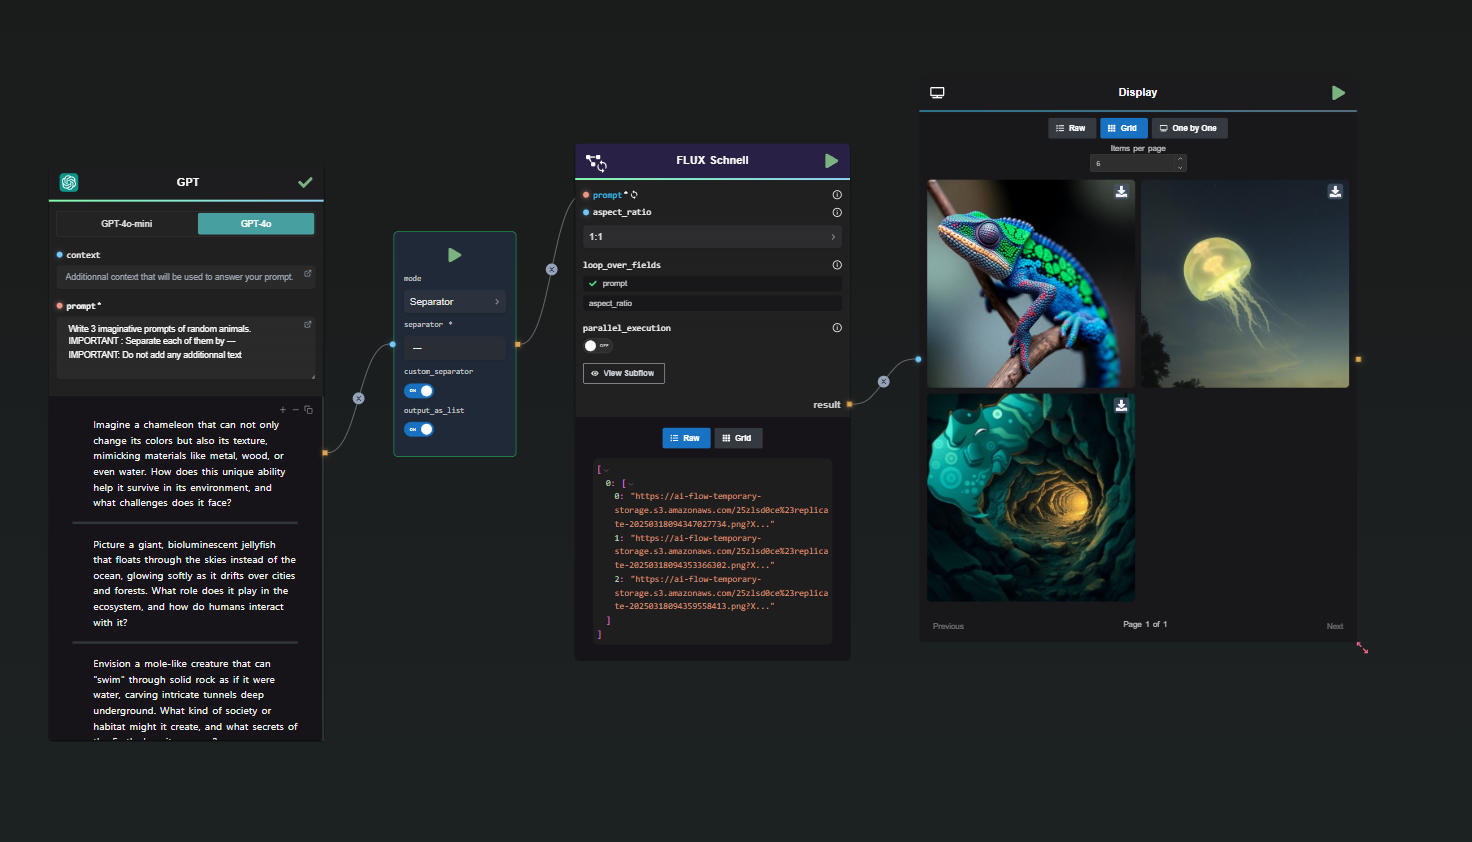
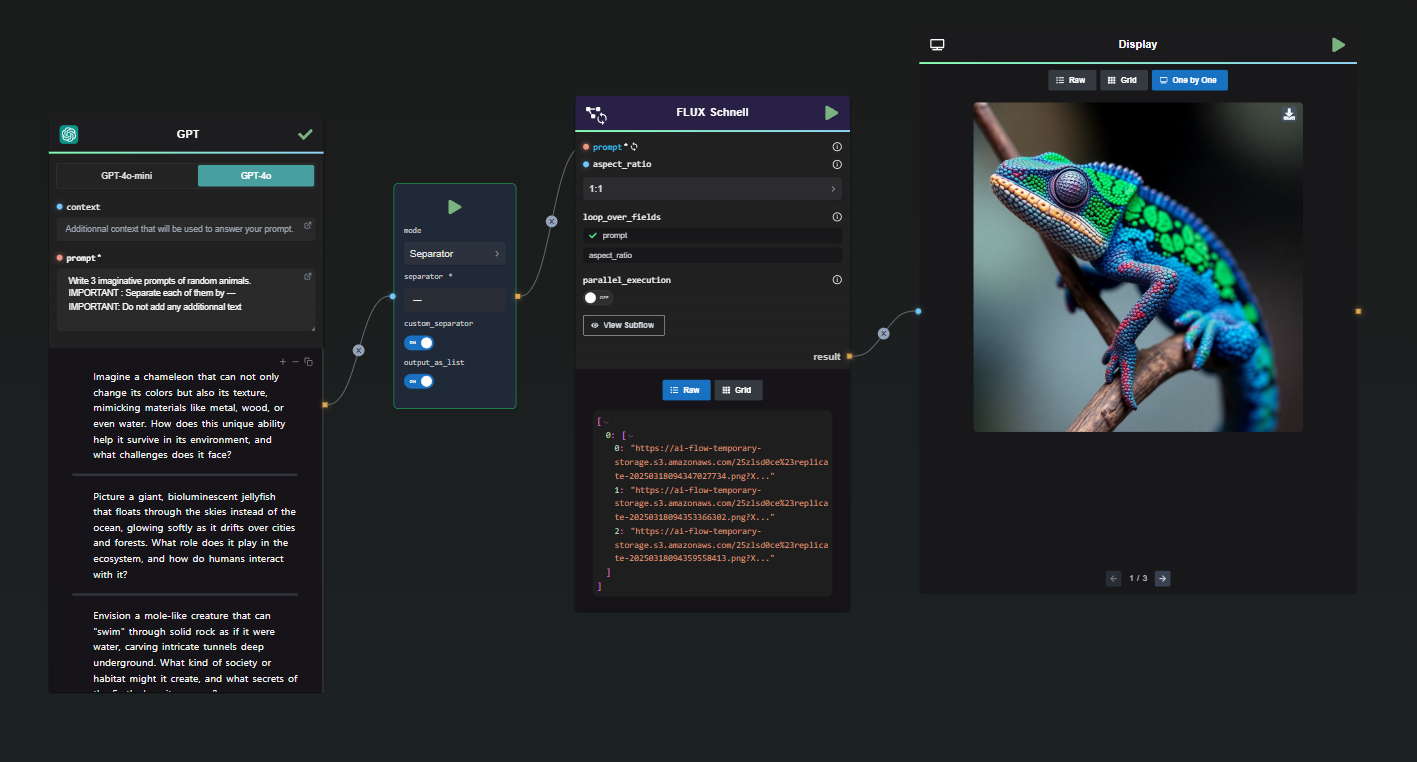
Display Node is capable of showing list outputs. If your node output is a list (like from a Data Splitter or a Subflow Loop), you can choose how to display it:
Raw View
- Shows the data exactly as-is, in a simple text format.
- Useful for quick checks or when you just need to verify raw output.
Grid View
- Displays the list in a clean grid layout.
- Great for visually scanning multiple elements at once, especially when dealing with structured data.
- Ideal for displaying images and videos.
One by One View
- Allows you to scroll through each item in the list individually.
- Perfect for inspecting elements in detail when working with large or complex lists.
Why It’s Useful
- Subflow Loops: When you’re looping through items and generating multiple outputs, the Display Node helps you clearly see each result.
- Large Lists: Whether you’re handling results from GPT, API calls, or batch operations, switching between Raw, Grid, or One by One views lets you easily navigate large amounts of data.
- Debugging: Use it to confirm outputs at any step before passing them to downstream nodes.
Best Practices
- Resize the node depending on how much content you’re working with.
- Switch between display modes based on what kind of data you’re viewing (Raw for quick checks, Grid for structure, One by One for detail).
- Pair with loops and splitters to make large or repeated outputs more readable.
Conclusion
The Display Node is more than just a visual output — it’s a key tool for understanding, debugging, and working with complex data structures in your workflow. Whether you're handling simple text or large dynamic lists, the Display Node makes it clear and manageable.